The honest answer to “what does a DC fast-charger station cost?” is that the quoted ranges are uselessly wide. Site-level estimates in the public literature run from $50,000 to well over $1,000,000, and none of those numbers are wrong — they are just describing different projects. Settling the question properly means breaking the project into its actual cost lines, looking at the data we now have from public deployment programmes, and naming the levers that shift each line.
Three datasets do most of the work below: NREL’s 2024 deployment cost work, the Atlas Public Policy / Paren analysis of the National Electric Vehicle Infrastructure (NEVI) program awards (the largest publicly auditable DCFC funding program in U.S. history), and Rocky Mountain Institute’s rate-design and infrastructure-cost work.
The cost stack, per port
A DC fast-charger project has five line items that matter. Their proportions shift with site, power level and utility region, but they show up everywhere.
| Line item | Typical share of total project cost | What drives it |
|---|---|---|
| DCFC hardware (charger + dispenser) | 20–35% | Power rating, network/payment software, cable cooling, branding |
| Electrical make-ready (conduit, conductor, panels, switchgear) | 25–40% | Distance from service, voltage class, trenching difficulty |
| Transformer / utility upgrade | 10–25% | Existing service capacity, utility tariff for upgrades |
| Civil works (concrete, bollards, canopy, lighting, signage) | 10–20% | Pull-through lanes, accessibility, canopy or no canopy |
| Soft costs (permits, engineering, project management, contingency) | 5–15% | Jurisdiction, utility queue length, AHJ inspection regime |
(Composite shares per NREL 2024 deployment cost work, Atlas / Paren NEVI analysis and Rocky Mountain Institute reports.)
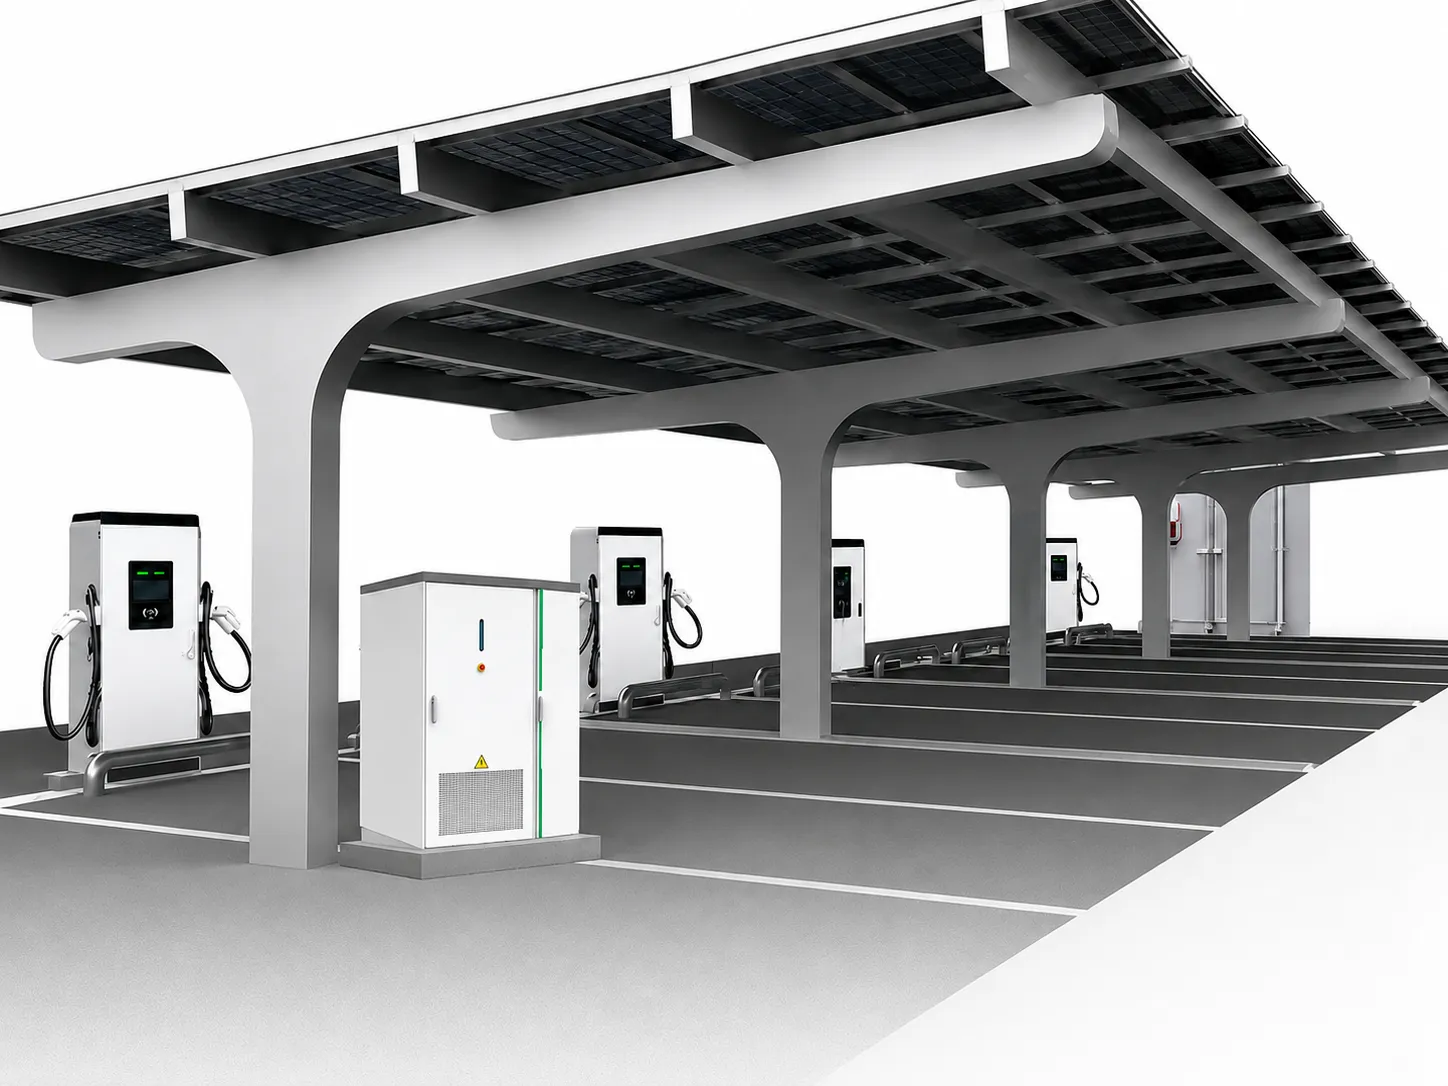
The single most useful thing to internalise from this stack is that the hardware is rarely the dominant line at a complex site. In a correctly read DCFC bid, the make-ready and the transformer/utility upgrade add up to as much as 50–60% of the total — frequently more than the charger itself.
Hardware by power level
The 150 kW and 350 kW units are now the dominant public-station classes. The 50 kW class has largely receded to lower-throughput sites; 400 kW and beyond exists for heavy-duty fleet and Megawatt Charging System (MCS) early adopters.
| Charger class | Typical use case | Networked unit price (2026) | Notes |
|---|---|---|---|
| 50 kW (single port) | Low-throughput public, AC tail | $25,000–$45,000 | Increasingly displaced by 150 kW |
| 150 kW (1–2 port) | Standard public DCFC | $55,000–$85,000 | Most common NEVI installation |
| 350 kW (1–2 port) | Highway corridor, premium public | $110,000–$160,000 | Liquid-cooled cables; full 800 V architecture |
| 400 kW+ / MCS | Heavy-duty truck, fleet, future passenger | $180,000+ | Custom site engineering required |
(Public manufacturer pricing and the NREL 2024 deployment cost dataset.)
Above ~150 kW per port, the utility-side cost line grows faster than the hardware line. Pushing 350 kW into a strip-mall parking lot typically means a new pad-mount transformer and frequently a service upgrade on the utility side of the meter — neither of which is on the equipment vendor’s bill of materials, but both of which land squarely on the project pro forma.
NEVI as the public dataset
The NEVI program made U.S. DCFC project costs unusually visible. Atlas Public Policy and Paren published an analysis covering 330 winning NEVI site awards to characterise the cost distribution.
| Metric | Value |
|---|---|
| Average total project cost | $915,420 |
| Median total project cost | $802,267 |
| Top quartile total project cost | $1,053,624 |
| Mean cost per port | $192,614 |
| Median cost per port | $183,116 |
| Sites covered | 330 |
| As of | Early 2025 |
(Per Paren / Atlas Public Policy analysis of the NEVI program; figures are project total before any operator rebates.)
These are higher than off-NEVI public stations, for three reasons. NEVI sets a four-port, four-bay minimum per site (each site is therefore at least 4 × 150 kW). It mandates 97% uptime and a substantial spare-parts and O&M posture. And it requires payment hardware and software interoperability that costs more than what a private deployer would choose. The figures still set the publicly defensible upper anchor for a four-port DCFC station built to a high standard.
The demand-charge problem
A DCFC station’s economics live or die on its electricity bill, and the electricity bill is dominated by demand charges at the typical public-site utilisation. Rocky Mountain Institute’s rate-design work has documented cases where demand charges drive more than 90% of the bill at low utilisation.
The arithmetic is mechanical. A utility commercial tariff bills both energy ($/kWh delivered) and demand ($/kW peak in the billing period). A 350 kW charger drawn briefly for one session sets the peak for the entire month. Until the utilisation rate rises far enough that the demand charge is amortised across many sessions per peak window, the operating cost per kWh sold can sit well above the energy retail price.
Two practical responses now show up in nearly every modern DCFC build. Rate-design reform (tiered or windowed demand charges, time-of-use design) addresses the tariff side. On-site battery storage addresses the load side — a 200 to 500 kWh BESS clipping the peak so the utility never sees a 350 kW spike. The companion insight on cutting demand charges with battery storage treats the storage option in detail.
Levers that materially move the number
The cost lines respond differently to project decisions. Five levers do most of the work.
| Lever | Where it cuts cost | Typical reduction |
|---|---|---|
| Build EV-ready during initial site construction | Make-ready (conduit, trenching) | 40–60% per connector vs retrofit (NREL) |
| Pre-fabricated charger platform / skid | Civil works, install labour | ~15% on total install (EVgo reported figure) |
| On-site BESS sized to clip 350 kW peaks | Electricity bill (demand) | 30–60% of demand-charge line in tariff-heavy regions |
| Co-locate PV + storage (PV-storage-charging integrated) | Energy + demand + grid-tie risk | 20–50% blended; depends on PV economics |
| Standardise on one vendor across transformer / switchgear / charger | Engineering + risk | Single-figure % but compounds with schedule |
Two of these — EV-ready during initial construction and on-site BESS — are underused at the early stage of programme design, and the projects that skip them are the ones whose pro formas end up underwater.
Fleet depots: the same stack, scaled
A fleet depot — bus, delivery van, drayage tractor — runs the same five-line stack but at very different proportions. Hardware is a smaller share because custom enclosures and high-power per-stall designs lower the unit cost contribution; civil works and utility upgrades are larger because the site power need is contiguous and concentrated. A 20-stall depot pulling 300 kW per stall asks for several megawatts of contiguous service that almost no urban site is fed for today, and the substation upgrade routinely becomes a custom job.
This is why nearly every modern fleet depot design now budgets for an on-site BESS or for a solar-storage-charging integrated system from day one. The grid side does not scale fast enough to meet a typical fleet schedule, and the economics of a BESS on a contiguous depot load are clearer than for a public station.
Where Entogo fits
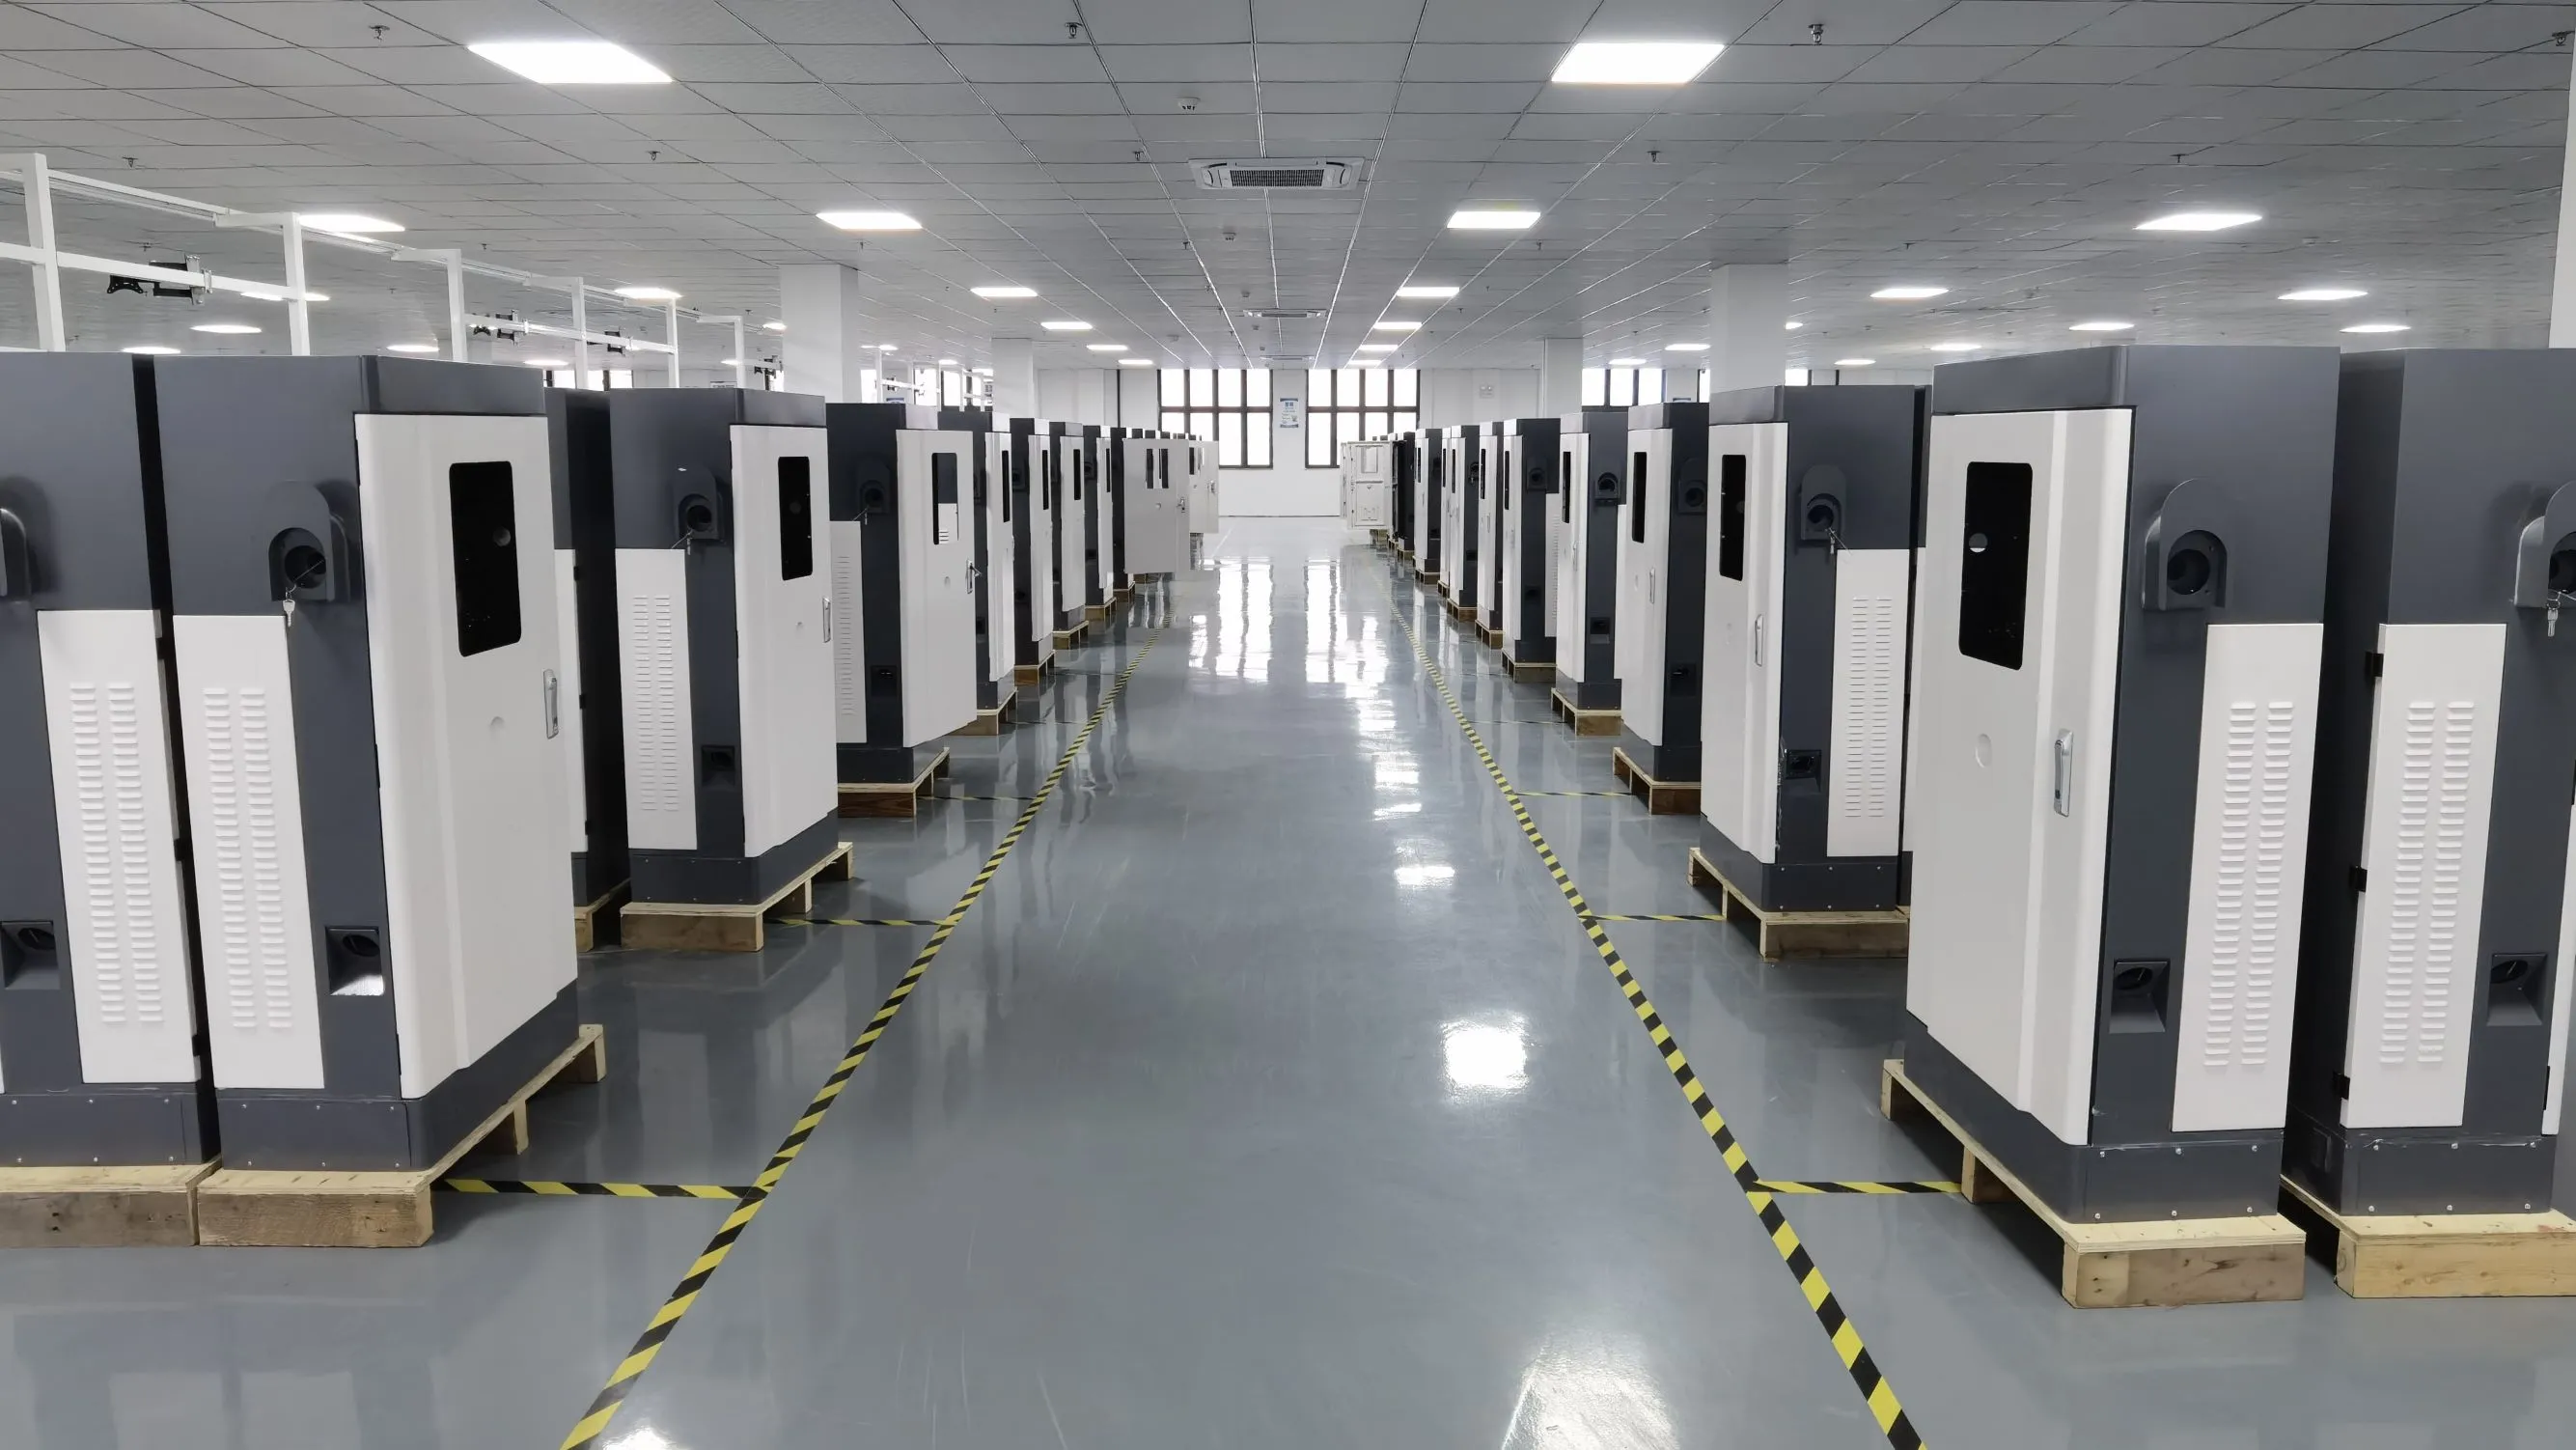
Entogo manufactures the equipment a DCFC project actually depends on across the hardware-and-infrastructure split: AC and DC chargers, pad-mount and prefabricated substation transformers, medium- and low-voltage switchgear, and battery energy storage systems. Several charger lines — the Rocket DC ultra-fast, Turbo, MoBox compact and the dual-gun PV-storage-charging unit — span 60 to 600 kW so a public network and a fleet depot can be sourced from the same vendor and on the same lead time.
European-standard (IEC/CE) catalogue equipment ships in an average of 12 weeks and within 36 weeks even when a product needs new UL or other North-American certification. For a public DCFC operator, that is the difference between catching a NEVI compliance window and missing it; for a fleet, it is the difference between a depot energising on the bus delivery schedule or after it.
The first useful thing to settle, when a DCFC project is in early scope, is the cost stack. The hardware sits in the middle of that stack — not at the top, and not at the bottom. Most of the conversation about “DCFC cost” turns out to be a conversation about everything else.